
How to Look Up Suffolk County Jail Population Data
The Sheriff's Office is the source for Suffolk jail population data. Its Corrections Division publishes the capacity of each facility, and its Incarcerated Individual Demographics page posts dated, weekly entries. Those weekly entries are where the current breakdown lives, updated as the population changes.
This page covers the published capacity and the structure of the data. It does not list one person's record. For an individual custody check, use the inmate records page and call Central Records. The demographics page is the place to read week-by-week counts.
Source: Suffolk County Sheriff incarcerated individual demographics.
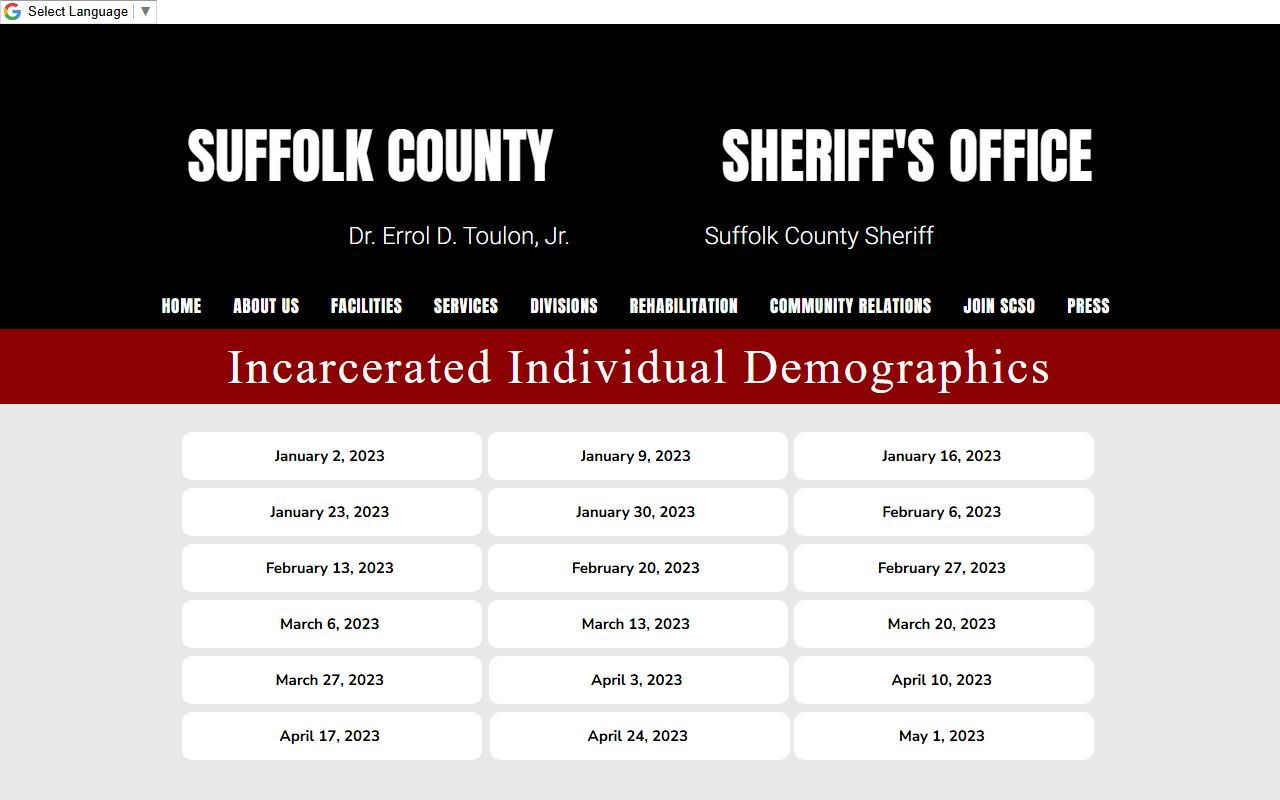
Because the page posts new dates each week, the figures you see depend on the date you open.
Suffolk County Jail Capacity Overview
Capacity is the firmest number. The Sheriff publishes a maximum capacity for each jail. Riverhead holds up to 840 and Yaphank up to 976, for a combined official capacity of 1,816. Both house men and women at minimum, medium, and maximum security.
| Facility | Capacity | Facility notes |
|---|---|---|
| Riverhead Correctional Facility | 840 | Linear and podular housing; medical, dental, and mental health units; rehabilitation; visiting. |
| Yaphank Correctional Facility | 976 | Dormitory and podular housing; medical pod; SATP; Veteran's Pod; 55+ Pod; Choose To Thrive; START. |
| Total official capacity | 1,816 | Sum of both Sheriff-published capacities. |
Capacity is the ceiling, not the count in custody on a given day. Actual population usually runs below the published maximum.
Average Daily Population
Average daily population, or ADP, is the typical number held over a period. Suffolk's live ADP is not posted as a single fixed figure, because it moves with arrests, bail, sentencing, and release. The Sheriff's weekly demographics are the closest official read on the current count.
So treat any single ADP number with care. The reliable approach is to read the latest weekly demographics for the date you need, then compare a few dates to see the trend. County budget and criminal justice reports also discuss ADP and cost per inmate per day, which round out the picture.
Why does ADP matter more than a snapshot? A single day can be unusually high or low. ADP smooths those swings into a number that planners use for staffing, medical care, and food service. When a news story or report cites a Suffolk jail figure, check whether it is a one-day count or an average, since the two can differ by a wide margin.
Riverhead Versus Yaphank Population
The two jails are not the same size or mix. Yaphank is larger and carries more specialized housing. Riverhead sits on the court campus and handles a steady flow tied to nearby arraignments and bail. The comparison below frames how the two differ.
| Point | Riverhead | Yaphank |
|---|---|---|
| Capacity | 840 | 976 |
| Housing | Linear and podular | Dormitory and podular, plus medical pod |
| Special programs | Choose Your Path | SATP, Veteran's Pod, 55+ Pod, Choose To Thrive |
| Campus | Court and records campus | Near probation and START |
Specialized Pods and Programs
A jail population is not one undivided group. Yaphank in particular splits its housing into specialized pods, and each shapes part of the count. The Sheriff's Addiction Treatment Program, known as SATP, houses people working through substance use. A Veteran's Pod groups former service members so reentry partners like the Northport VA can reach them. A 55+ Pod houses older incarcerated people, who often have more medical needs.
Yaphank also runs the Choose To Thrive program for women and hosts the START Resource Center on site. Riverhead runs the Choose Your Path program. These groupings explain why two facilities of similar size can carry very different populations. When you read weekly demographics, the totals reflect this mix of general housing and specialized pods.
Pretrial and Sentenced Population
A jail population mixes two main groups. Some people are held pretrial, meaning their case is not yet decided. Others are sentenced and serving a local term. The Sheriff's weekly demographics break down the makeup, though the exact pretrial and sentenced split changes constantly.
This split matters for understanding the count. Pretrial numbers respond quickly to bail rules and court speed, while sentenced numbers move with case outcomes. People held on holds for other jurisdictions can also appear in the total.
The pretrial share is the part most affected by reform. When the law limits cash bail for many charges, fewer people sit in jail while their case is pending. That is exactly what Suffolk saw after 2020. The sentenced share, by contrast, tracks how quickly courts resolve cases and the length of local terms.
Mental Health, Medical, and Program Population
A share of the population needs medical or mental health care. Both jails run medical, dental, and mental health units, and Yaphank adds a dedicated medical pod. The Sheriff also operates treatment and rehabilitation programs that house specific groups, such as the Sheriff's Addiction Treatment Program and the Veteran's Pod at Yaphank.
The Sheriff's reentry and rehabilitation page outlines the programs that shape how the population is housed.
Source: Suffolk County Sheriff reentry and rehabilitation.

These pods explain why the count is not a single undivided number but a set of housed groups.
Bail Reform Effects on Population
New York's bail reform reshaped the count. The law took effect on January 1, 2020. The Sheriff reported that remanded inmates were down 64% from the same period the year before, and that 301 inmates were released from November 15 through December 31 in anticipation of the change.
That drop shows how policy moves a jail population fast. It also explains why older population figures may not match current ones. For trend claims after 2020, the Sheriff's weekly demographics and county budget reports are the better source.
Note: Population figures from before 2020 reflect different bail rules, so compare like periods when you study a trend.
Population Trends Over Time
Trends tell a clearer story than any single day. A county jail count rises and falls with arrests, court speed, bail policy, and sentencing. Suffolk's sharpest recent shift came from the 2020 bail reform, which cut the remanded count steeply almost overnight.
Older reports do not map onto current numbers. A county jail population analysis from years past, or a press figure from before 2020, reflects different rules and a different climate. For a current trend, the right method is to read several weeks of the Sheriff's demographics in a row and watch the direction, rather than lean on one historical figure. County budget narratives also track average daily population year to year, which helps confirm whether a trend is real or just weekly noise.
National and State Context
County jail counts make more sense against a wider backdrop. National jail data is compiled by the federal Bureau of Justice Statistics, and research groups track New York trends. Those sources help you judge whether a county count is high or low for its size.
Suffolk's published capacity of 1,816 is a county-specific figure from the Sheriff. Any per-resident rate or national comparison should be drawn from the federal and statewide datasets, not estimated, and clearly labeled as state or national rather than county-specific.
This honesty matters. It is easy to find a national jail rate per 100,000 residents and apply it to Suffolk, but that produces a guess, not a fact. The cleaner path is to report Suffolk's own published capacity and weekly counts, then point to the federal and state datasets for anyone who wants to compare counties. Mixing the two without labels is how bad numbers spread.
Searching for Suffolk County Inmate Records by Name
This page is about population data, not a person. To check whether one individual is in custody, that is a name lookup, not a population query. Use the inmate records page and call Central Records at (631) 852-2241 with the person's name and date of birth.
Where the Population Data Comes From
Three official sources carry the numbers. The Sheriff's Corrections Division publishes capacity. The Incarcerated Individual Demographics page posts weekly counts. County budget and criminal justice documents add ADP and cost detail. Together they give the most reliable read on Suffolk's jail population.
Avoid third-party sites that claim a live county count, since the official weekly demographics are the authoritative source. For the facilities and custody process behind these numbers, see the inmate records page, and the released inmates page for release tracking.
One last point on reading these sources. Capacity comes from the Corrections Division and rarely changes. Weekly counts come from the demographics page and change often. Long-run figures come from county budget and justice reports. Each answers a different question, so cite the one that fits, and note the date, because a Suffolk jail number without a date is hard to trust.